With each segment impacting the next, triathlon really is one sport. There are a lot of reasons for a “bad” run, but improper pacing in the previous segments (i.e., the swim and the bike) is often a common cause. Here’s a guide to specific pacing strategies for your swim, bike, and run so you can finish strong on race day.
Swim
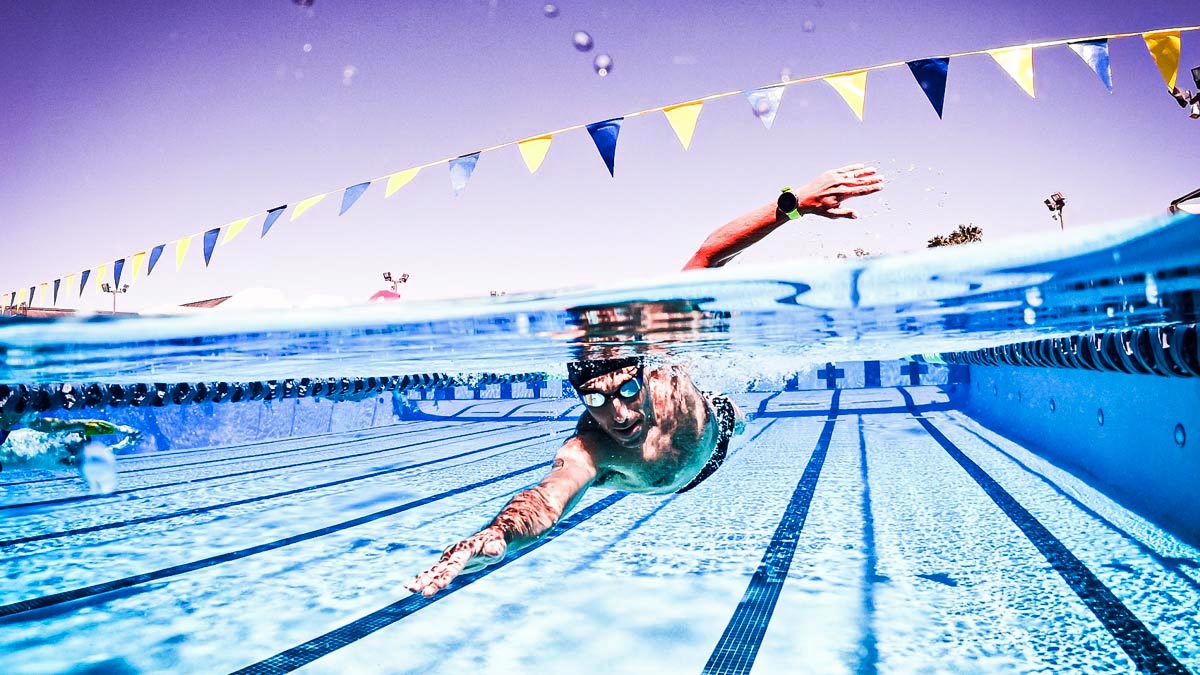
The swim might be the shortest portion of the race, but it sets the tone for the day and will impact your performance on the bike and run. While you may not win your goals during the swim, you certainly can lose them there.
Studies of the impact of swim effort have found that improper pacing (or fitness) for the swim can increase blood lactate significantly in the opening moments of the race. When this happens, your HR will remain elevated beyond your norm. In some cases, this jump in HR can be 4% or more. Here’s how to avoid these sorts of issues.
Start Smart
Before you even get into the water, apply the Start Smart Principle with a proper warm-up. If you are permitted, get in the water for a swim-based warm-up. If this isn’t possible, complete a dryland functional warm-up. This can include a light jog followed by dynamic stretches.
On the start line, seed yourself appropriately to avoid getting swept up by faster swimmers, which can throw you off your game plan. For 70.3 or 140.6, the best strategy (for most) is to start off controlled and work into your race effort within the first few hundred yards.
Your race effort should follow your training protocol. For a 70.3, you may shoot for 85-90% of max; for 140.6, your effort may be in the 75-85% of max range. Ultimately, however, your experience will dictate the level of intensity that is appropriate for you as these ranges may not work for your individual ability.
It is also worth noting that technique is more important than effort, so it is important to swim at an effort during which you can maintain proper form. A mix of RPE and feel for the water should help drive this decision for pacing during the swim.
Stay on Course
Understanding the rhythm of the course and your comfort level around other swimmers should play a role in how you plan to approach the swim course. Are you going to hug the buoy line? Stay outside the fray? Or you may want to start outside the commotion and work your way in closer to the buoy line. Determine your strategy, but if circumstances change, be flexible and adapt. Also, make sure you sight regularly so you can maintain as straight a line as possible relative to your strategy.
Drafting
There is good reason to draft, as estimates say it can reduce energy expenditure by 30% and reduce overall time by up to 3 minutes or more for 2.4 miles. That is akin to years in swim math!
Take opportunities to draft off another swimmer when possible. This is best accomplished by swimming at someone’s feet or with your head near their hip. However, if you’re spending a lot of energy trying to find drafting opportunities, it’s better to just focus on your own effort and technique.
Bike
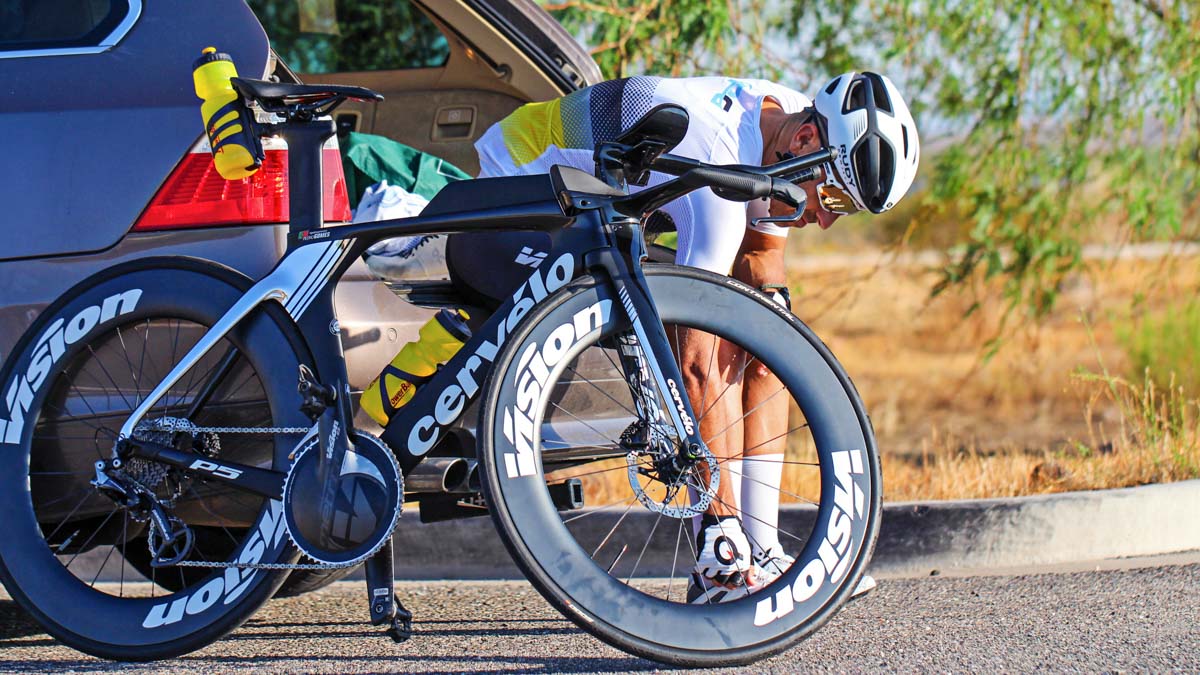
A triathlon bike is not about your fastest possible bike — it’s about an optimal bike that allows for a strong run. Based on your experience, there are varying degrees of wiggle room between bike effort and run effort. Determine these edges in training so you can ascertain the cost of energy expenditure on the bike in relation to energy availability for the run. This matters regardless of race duration.
Bike Pacing Metrics
You can use a variety of metrics to determine this “wiggle room”, such as intensity factor (IF). IF is a percentage of your threshold using either watts or heart rate. Below is a table of target IF ranges for different race durations. You can use these as general guides to help with your pacing strategy.
| Race Duration | IF-Power | IF- Heart Rate | RPE |
| Sprint Triathlon (10-18 mile bike) | 88-98% FTP (functional threshold power) | 93-100% of LTHR (lactate threshold heart rate) | 9-10 |
| Olympic Triathlon (25 mile bike) | 85-95% FTP | 90-97% LTHR | 8-9 |
| 70.3 Triathlon (56 mile bike) | 72-85% FTP | 88-95% LTHR | 6-7 |
| 140.6 Triathlon (112 mile bike) | 60-75% FTP | 80-89% LTHR | 4-5 |
| Double+ Triathlon (224 miles+) | Under 60% FTP | 70-79% LTHR | 3 |
Please note that these ranges should be tested and verified in training to determine what works best for you. There are always individual and external circumstances that will impact what is the appropriate target for you. For example, on a hot day, 70% of FTP may come with a different energy cost than it would on a day with moderate conditions. Also, note that power is a more reliable indicator of outcome effort than HR; however, HR should be monitored as it tells you how your body is responding to an effort on any given day.
For hills, you may increase the watt caps by 5-15% or so, depending on the nature of the hills and your bike fitness and experience. Heart rate caps can go to the bottom of the next zone. It’s worth noting that HR and RPE can take some time to “catch up”, so be smart with your hill strategy!
Training Stress Score (TSS) is another method you can use to figure out appropriate pacing and can be particularly useful in mimicking race stress in your weekly training. By completing training rides that accumulate at or near the TSS you’ll generate on race day, you’ll be adequately prepared for your race day effort. Below is an overview of target TSS ranges for the bike portion of some common triathlon distances:
- Sprint: up to 60 TSS
- Olympic: 90-120 TSS
- 70.3: 150-190 TSS
- 140.6: 250-320 TSS
- Double+: 500+ TSS
To determine the right combo between IF and TSS, you can use a tool like Best Bike Split to get an estimate of how long the bike will take, which in turn can help you plot the intensity that’s appropriate for both the duration and the terrain.
Run
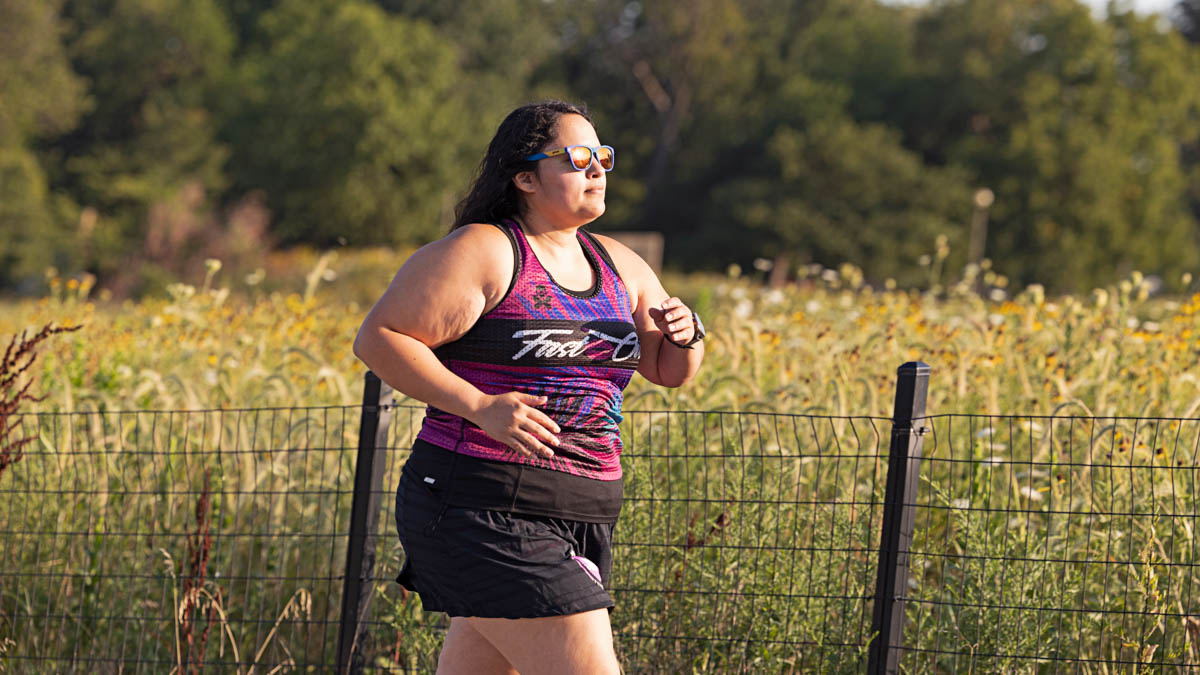
Set the foundation for a well-paced run by resisting the temptation to leave T2 as if you were shot out of a cannon. Take time to find your rhythm as you begin your run. Even-ish splits across a race will produce a better outcome than trying to aggressively “bank time” at the start.
Banking time at the front often results in more lost time on the back half. While we may lose speed at the end of a race, especially in a long course, this should not be substantial (assuming proper fitness, a well-paced bike, and adequate fueling and hydration). The best racers are the ones who slow down the least.
A loss of speed in the second half is not necessarily an inevitable conclusion. It is possible to even (or negative) split the run. Practice this strategy in training and incorporate multiple bike-to-run bricks throughout your week.
Run Pacing Metrics
In terms of intensity targets, use the following estimates in the table below as a general guide.
| Race Duration | HR | RPE | TSS |
| Sprint Triathlon (5k) | 95-100% LTHR | 9-10 | 25-40 |
| Olympic Triathlon (10k) | 90-98% LTHR | 8-9 | 50-70 |
| 70.3 Triathlon (13.1 miles) | 88-95% LTHR | 6-7 | 110-170 |
| 140.6 Triathlon (26.2 miles) | 80-89% LTHR | 4-5 | 200-250 |
| Double+ Triathlon (52.4 miles+) | Under 85% LTHR | 3 | 400+ |
During the race, several factors can impact your ability to pace your best triathlon run. Be sure to:
- Fuel and hydrate on the bike, as well as the run.
- Pace the bike appropriately, as an over-effort on the bike will equate to poor running performance.
- Keep HR elevated into at least Zone 2. If you notice it dropping, try some strides.
- Work hills strategically. Run or hike up as appropriate, and practice running skillfully and quickly downhill.
- Apply mental fitness skills for pain and fatigue management.
Our best race effort comes from a collection of 1% details, each of which adds up to 100% of our race day success. Proper pacing includes many of these small details and allows you to perform your best with the fitness you have and the conditions that come with the day.
Race strong and smart!
References
Barragán, R. et al. (2019, July). Effects of swimming intensity on triathlon performance. Retrieved from https://www.researchgate.net/publication/334588421_Effects_of_swimming_intensity_on_triathlon_performance
Etxebarria, N. et al. (2013, September). Cycling Attributes That Enhance Running Performance After the Cycle Section in Triathlon. Retrieved from https://www.researchgate.net/publication/256501349_Cycling_Attributes_That_Enhance_Running_Performance_After_the_Cycle_Section_in_Triathlon
Lopes, R.F. et al. (2012, May). Heart Rate and Blood Lactate Concentration Response After Each Segment of the Olympic Triathlon Event. Retrieved from https://www.scielo.br/j/rbme/a/Y6tMwmCXy6NZVRZQ4NBMBvN/?format=pdf&lang=en
Olcina, G. et al. (2019, May 16). Effects of Cycling on Subsequent Running Performance, Stride Length, and Muscle Oxygen Saturation in Triathletes. Retrieved from https://www.ncbi.nlm.nih.gov/pmc/articles/PMC6572577/
Peeling, P.D. et al. (2005, December). Effect of swimming intensity on subsequent cycling and overall triathlon performance. Retrieved from https://pubmed.ncbi.nlm.nih.gov/16306507/
Pryor, J. L. et al. (2018, November). Pacing Strategy of a Full Ironman Overall Female Winner on a Course With Major Elevation Changes. Retrieved from https://journals.lww.com/nsca-jscr/Abstract/2018/11000/Pacing_Strategy_of_a_Full_Ironman_Overall_Female.10.aspx
Rothschild, J. & Crocker, G.H. (2019, April 5). Effects of a 2-km Swim on Markers of Cycling Performance in Elite Age-Group Triathletes. Retrieved from https://pubmed.ncbi.nlm.nih.gov/30959840/
