The later part of the cycling race and event season is the ideal time for coaches and self-coached athletes to start forming goals for the next year. When setting goals and building training plans to meet those goals, it is important to consider the individual characteristics of the athlete. WKO4 is a very useful and powerful tool in identifying these individualities.
Identifying Goals for an Annual Training Plan
In order to build a training plan to meet specific goals, we have to identify both the demands of the goal event(s) and the athlete’s current strengths and limiters. Getting the right balance between them needs to be process driven. Every coach or self-coached athlete works differently, and WKO4 allows you to create your own process of planning an athlete’s training; in this article I will demonstrate part of mine.
The first thing to do is to look at the demands of the “A” priority goal race; I covered this in a previous article here. Once we know the demands, the next step is to look at the athlete’s current strengths, limiters, and performance markers. These can be used in combination with event demands to form challenging and realistic goals.
Let’s say your goal race for this year is the same event as last year, that you have a previous workout file from this event loaded in WKO4, and that the event demand goals have been identified. The image below shows some key metrics from last year’s event file, using the Matches Burnt by Pmax FRC chart in the WKO4 Chart Library.
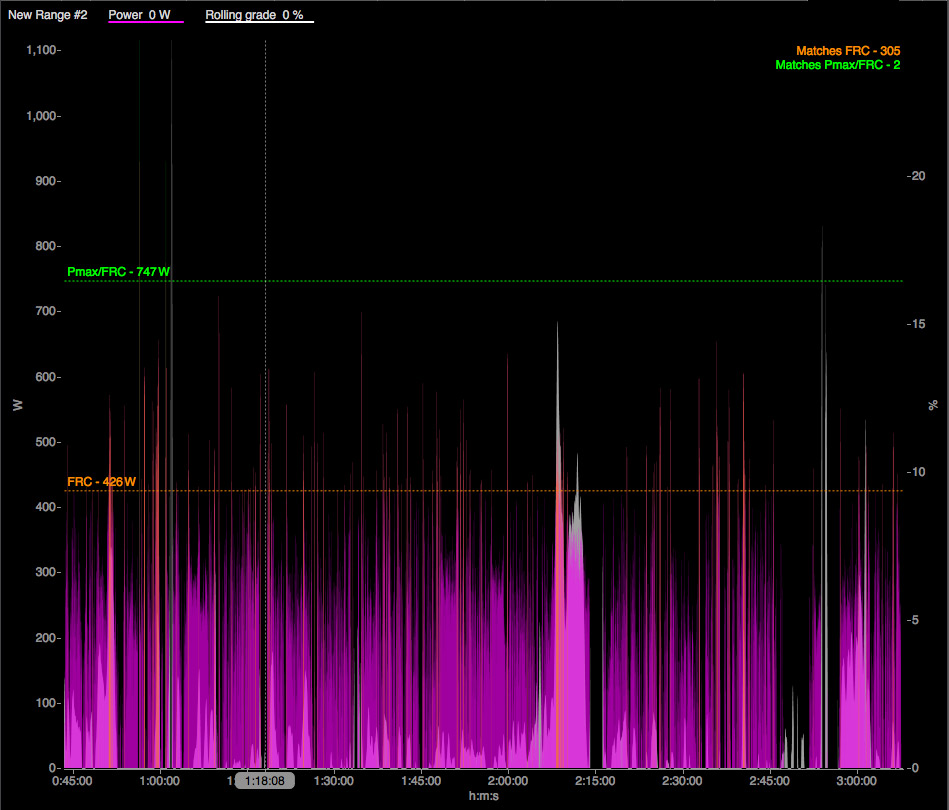
We can see that the FRC match burn rate is around 100 per hour for three hours. This is relatively average for mass start races, but more fatigue resistance is needed for three hours than in a criterium.
Let’s take a look at strengths and limiters. As we can see in the WKO4 dashboard below, this particular rider is an all-rounder phenotype with the biggest limiter at 15 seconds, as shown in the W-kg comparison chart, up to around 30 seconds, as shown in the WAC and Strengths – Opportunities charts (both of these charts are available in the WKO4 Chart Library, titled “My Wac score chart” and “PD Curve Profile S & W Chart”).
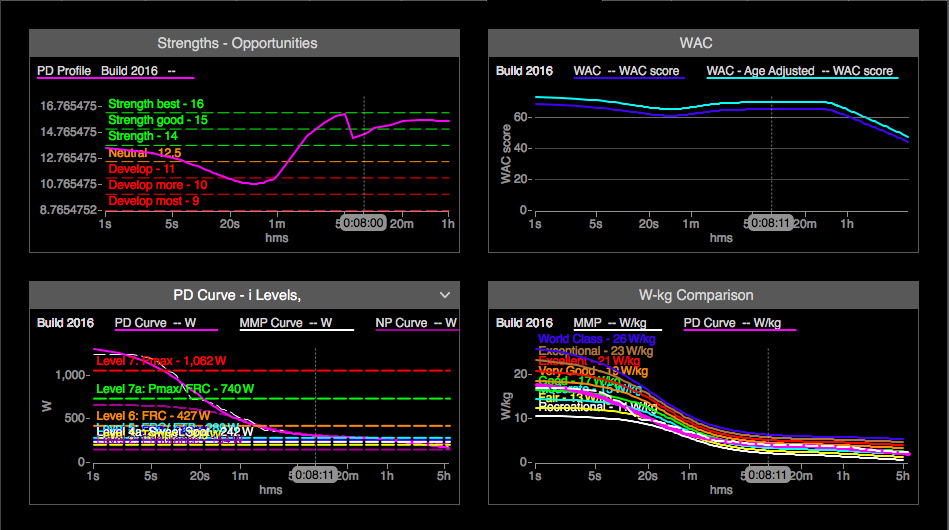
To match these strengths and limiters to the event’s demands, look back over the FRC matches burnt; we can see that anaerobic effort will be needed, and this should be incorporated into the plan.
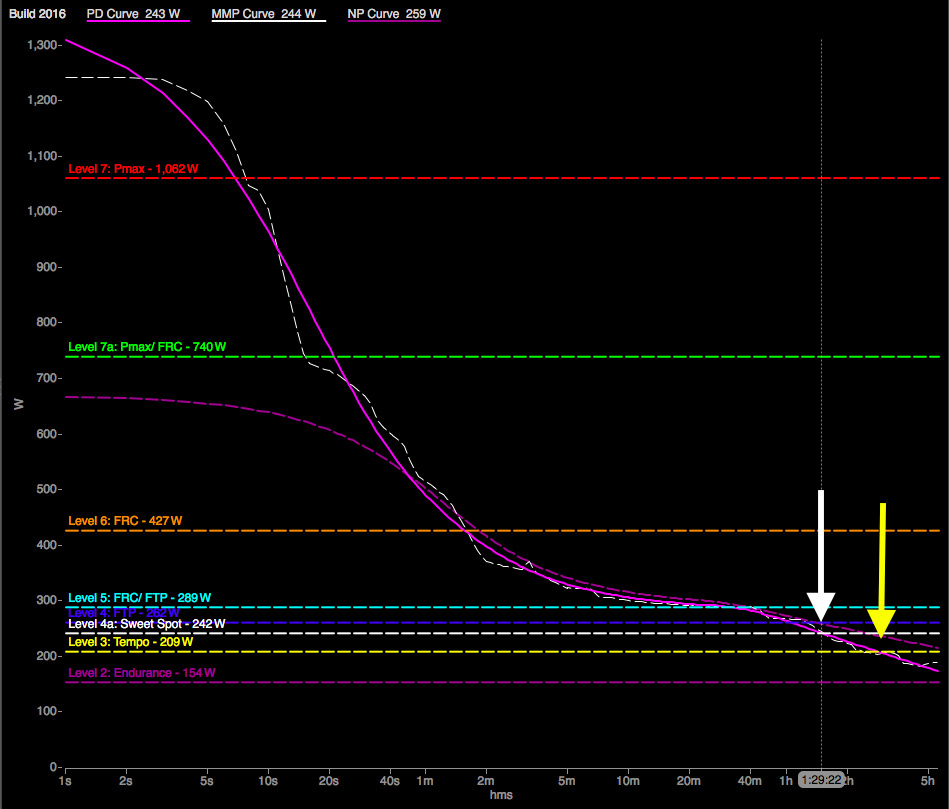
If we take a look at the PD Curve with iLevels chart in WKO4 (shown below), this athlete’s performance at the tempo level (the yellow line) has been well established out at three hours duration, but Sweet Spot (the white line) has potential to improve to be in better shape for the three-hour event shown in the matches chart above.
Forming the Training Phases
When considering training phases, I start at the end and work back to the first training phase of the season; I look at up to two “A” priority races and time taper first, then work back through weekly timing of the race, build, base, and transition phases, with everything aimed at success in the goal events.
I use historical data to conduct a season review to establish what worked and what did not work previously. In order to optimize the taper as much as possible, I refer back to the previous season’s best and at what CTL and TSB it occurred; the image below shows the mFTP versus CTL Peaks Chart in the WKO4 Chart Library.
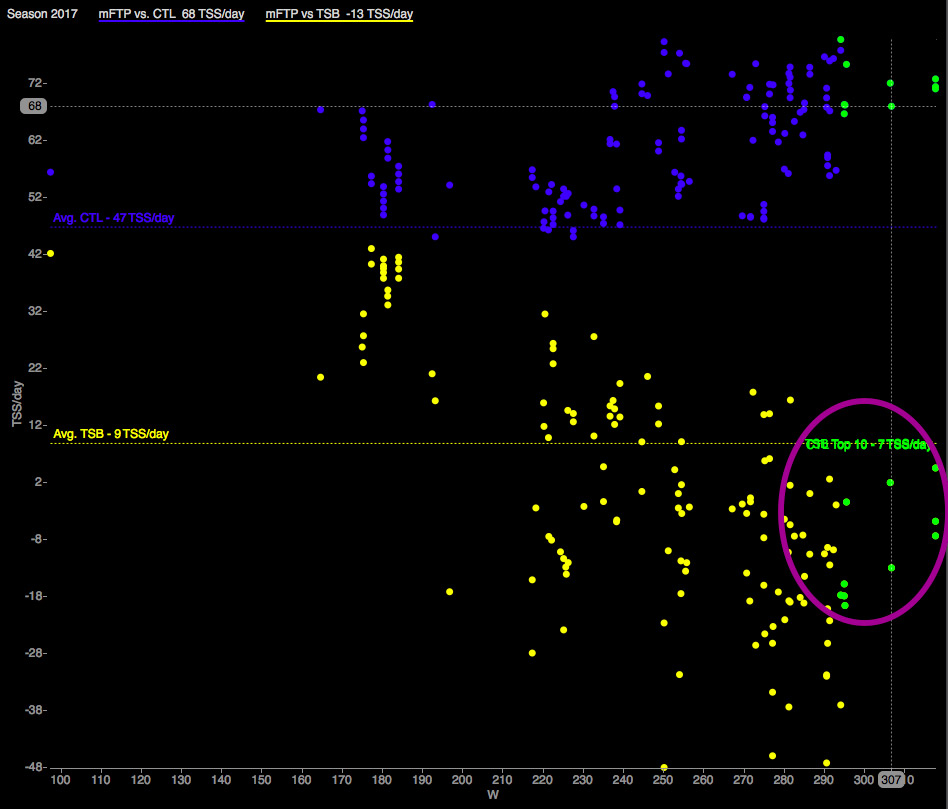
The previous optimum TSB should be considered in combination with the length and intensity of the event being trained for, planning further into positive TSB for the start of longer events and further into negative TSB for the start of shorter events.
Refer back to the Performance Manager Chart (PMC) in combination with peak power durations to determine what CTL worked to get to best form. Lower CTL can mean a less-than-optimal training dose and adaptation for the season, and too much CTL too early in the season can only be sustainable for a given period before halting any further gains. Finding the middle of this balance is an art, and it is quite individual.
Once you’ve got your target TSB and CTL, you can then develop a strategy to get there with the TrainingPeaks ATP.
Timing of workouts
When planning the timing of workouts, WKO4 eliminates some of the guesswork, and the PMC (Performance Manager Chart) from the previous season can be used to analyse the effects of CTL ramp rate. The chart below (the Weekly Ramp Rate chart in the WKO4 Chart Library) shows that this rider can sustain a ramp rate of around 3 for a prolonged period (in green) and 8-10 for a short term period (in purple).
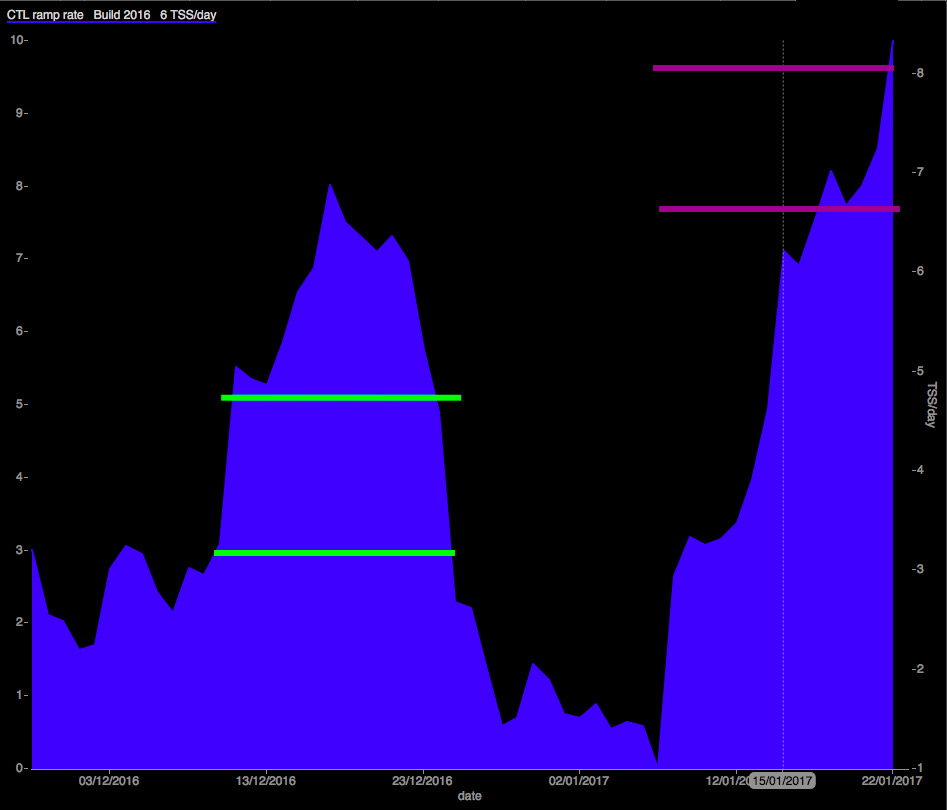
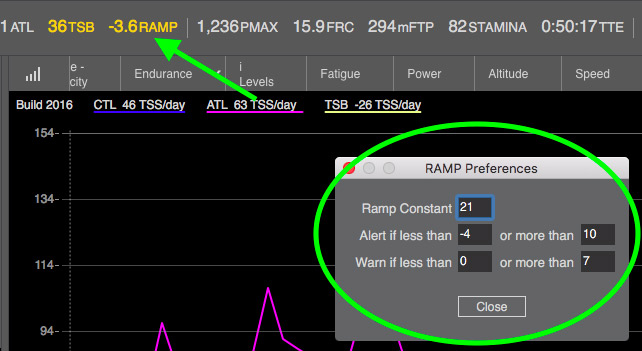
You can use this chart to look at previous seasons and determine optimal CTL ramp rate parameters, and these, once established, can be controlled within the TrainingPeaks ATP. You can also set up individualised alerts in the WKO4 Hero Bar to reflect this, as seen in the screenshot below.
Going back to the Performance Manager Chart (PMC), let’s take a look at the rate of ATL progression and what effect, positive or negative, it had on the response to the training dose or completed training.
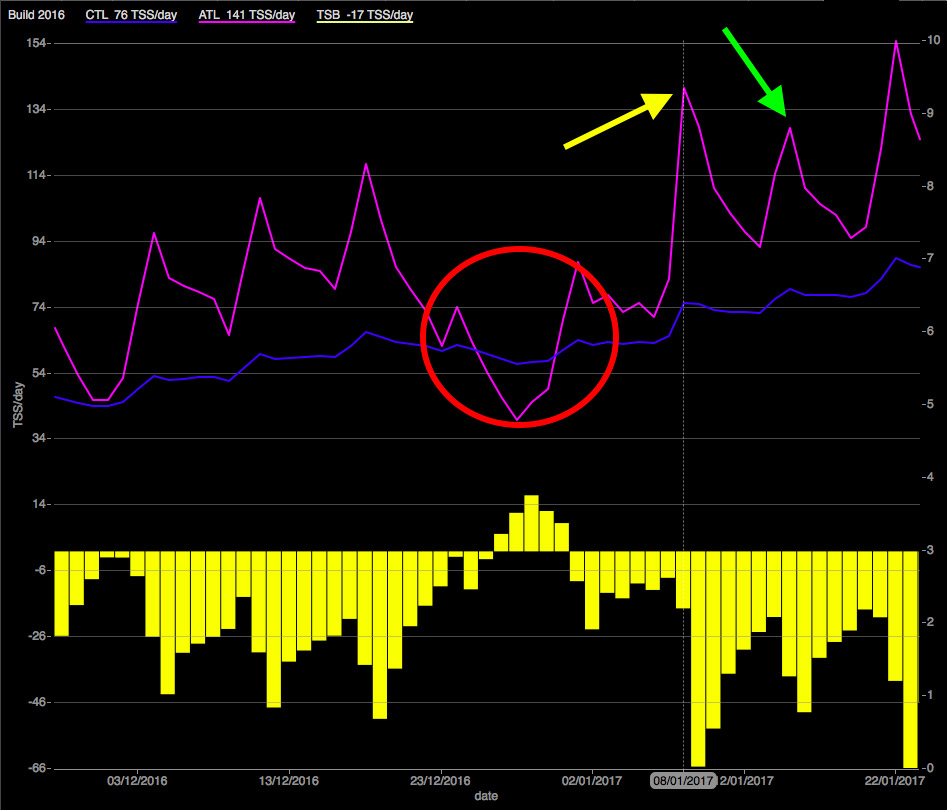
In the chart above, we can see that apart from the rider’s Christmas break (circled in red), an ATL over 140 (the yellow arrow) is not sustainable to build at a consistent rate over more weeks than an ATL of 120-130 (the green arrow), given where the CTL was at that point in time.
Structure of Intervals
When prescribing the training dose of intervals in workouts, there are several tools that are useful guides in blending the art and science of training prescription.
First, optimized intervals in WKO4 offer a brilliant, specific guide. Consider the demands of the goal event in combination with the aims of each training phase.
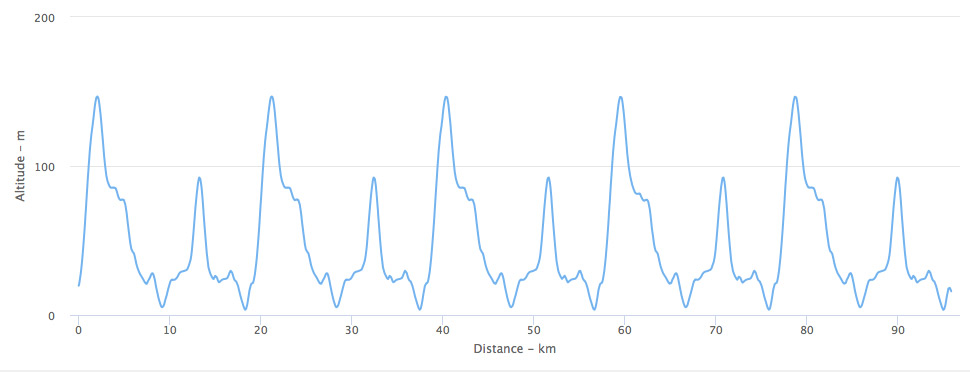
Through each training phase, try to set a main focus and supporting targets. For example, for something as specific as training for a 16km/10-mile time trial on a build phase, we can mainly use intensive aerobic and max aerobic intervals with supporting intervals such as extensive aerobic. To improve an athlete’s aerobic engine for a time trial like this, the max aerobic intervals will be more effective with full recovery. Where event specifics may play a part in recovery between intervals is improving fatigue resistance for a course profile similar to the road race represented in the chart below.
These are examples of small parts of a bigger picture. Use them within a full training plan to blend the best specifics and individualities.

