With so much emphasis on weight and more recently aerodynamics, we often overlook another major force component that riders must overcome to propel the bike forward: rolling resistance.
When we first created Best Bike Split we took in as much data as we could find to create some standard baseline coefficient of rolling resistance (Crr) values based on the typical tire types and sizes of the time. We also provided a way for users to input known values if they had them to help make the model more accurate.
In the subsequent years tire manufactures have come a long way in making faster tires, common tire widths have expanded, and we have branched into modeling some new types of non-road races.
Best Bike Split was past due for an update to the system, so we have recently “rolled” out some changes to help fine tune Crr settings, as well as highlight the impact of various tire rolling resistance value changes to overall performance and expected finish times on race day.
To explain the process we went through on these updates, I want to first discuss why rolling resistance is important, talk about a company that is helping to standardise the way we look at tire data, and look at some case studies to highlight just what this means for athletes in real world scenarios.
Coefficient of Rolling Resistance
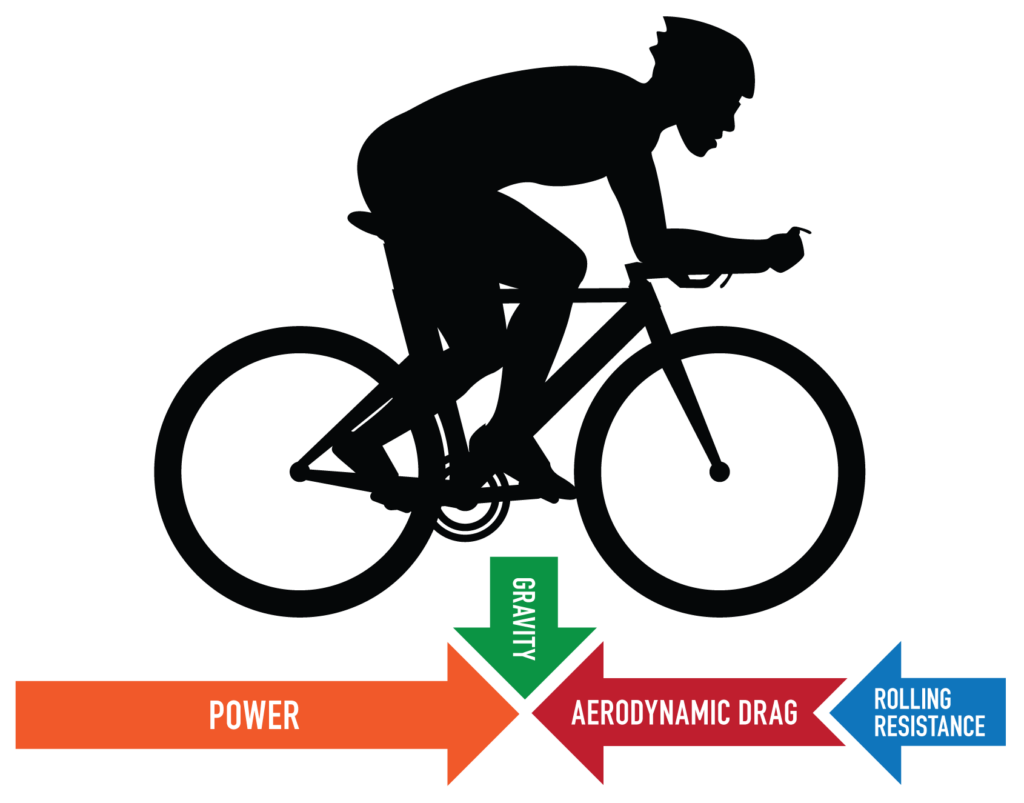
To get insight into what Crr is let’s first dive into the great force equation of cycling. The illustration below simplifies the concept but the key takeaways are that anything you can do to lower the forces against you will help you go faster for the same amount of power or maintain speed for a lower power output.
So what exactly is Rolling Resistance? It is simply the friction between your tires and the road. The greater the friction, the slower you will go. Poor road conditions, lower quality tires and tubes, rider weight, and speed all contribute to adding friction and thus slow you down. Tire pressure also plays an important role, but like tire quality and road conditions it is baked into a single parameter called coefficient of rolling resistance (Crr).
To help understand just how these variables impact rolling resistance we will dive into the actual equation:
Notations:
| 𝒈 | Gravity |
| G | Gradient of Road |
| Wkg | Weight in Kilograms (Rider+Bike) |
| Crr | Coefficient of Rolling Resistance |
| 𝒗 | Velocity |
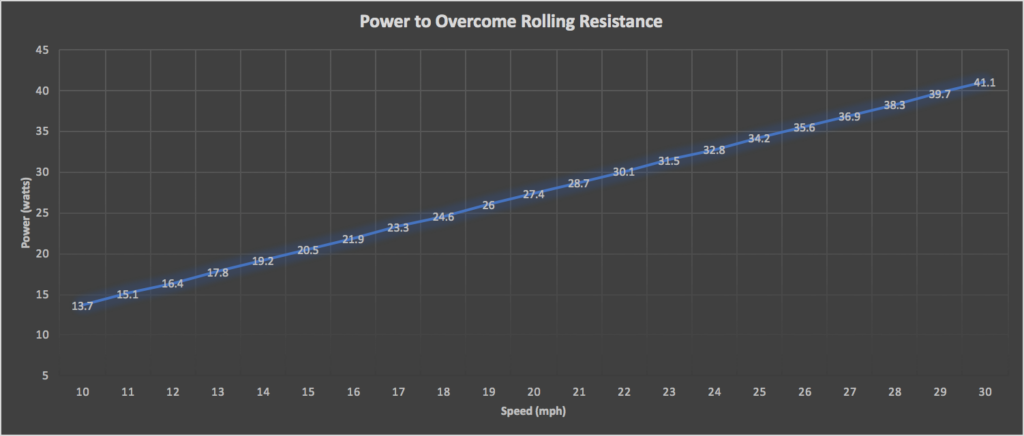
It’s easy to get lost in the notations above, but what’s really important is that the Power needed to overcome the friction increases linearly with speed. The faster you go the more power you will have to produce.
The chart below shows how much power is needed just to overcome this force as speed increases using a typical rider weight of 160 lbs with an 18 lb bike and general Crr for a properly pressured Continental 4000s II tire with butyl tubes over average flat road conditions.
As shown above for the typical speeds that athletes ride, rolling resistance can make up a significant portion of the required power output, but how do you make a knowledgeable choice when selecting tires and modeling race plans?
Tire Data to the Rescue
With bicycling aerodynamics we are starting to see more and more standardized testing and reporting; however tire manufactures don’t seem to have a standard rolling resistance test nor do they often report numbers to consumers.
Originally, we gathered up as much data as we could find and ran it through a machine learning model to determine the key characteristics (assuming relatively optimal tire pressure) that drove differences in Crr values. The results based on the data we had were that tire width, tire type, and tube type were significant and we developed baselines off the resulting equations.
The data showed that wider tires were generally better, clinchers had caught up or surpassed many tubular tires, and that latex tubes were significantly better than butyl.
In the past five years since our original modeling, tires have gotten wider, tubeless tires have gotten better, and new materials have helped drop the Crr of tires considerably.
The dilemma was that we did not have adequate data to rerun our original analysis. Luckily a company aptly named bicyclerollingresistance.com saw the same issues we did and stepped in to help. Their site gives consumers an insight into tire data not formally available, along with some real world impact in terms of watt savings for their specific test setup.
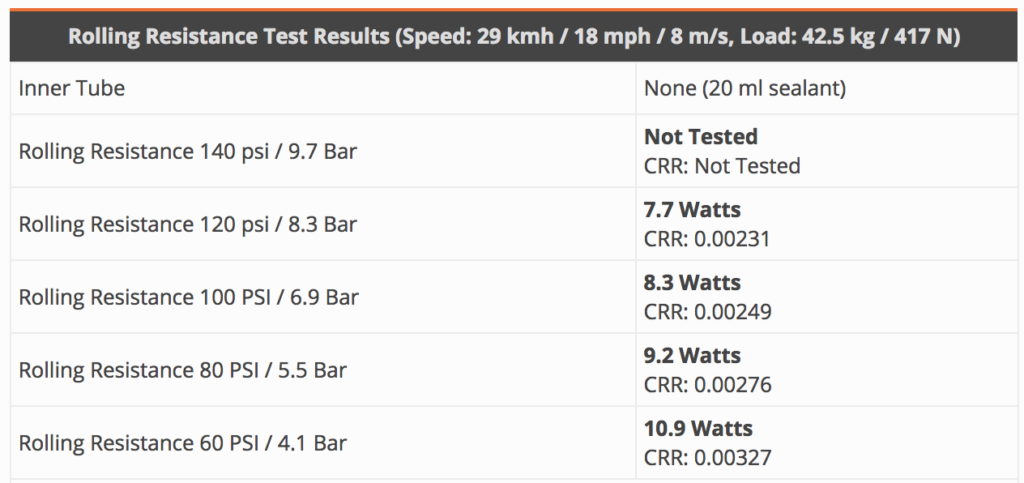
Based on what they have done we have adjusted the way we model Crr to adhere to their reporting standard. If you are using a tire they have tested you can simply look up your tire in their comparison chart, select your tire if available, and find your Crr value from the Rolling Resistance Test Results table (example below).
Once you input this value into your BBS bike Crr settings, we can take the power analysis to a new level by showing the real world impact of that rolling resistance change for an athlete on race day and the impact of changing Crr within a race plan using our Time Analysis Tool.
What’s the Real World Impact?
Quickly jumping back to the equation we know that weight and Crr impact rolling resistance, but just how much is one worth versus the other? To answer that question we need to do some quick analysis.
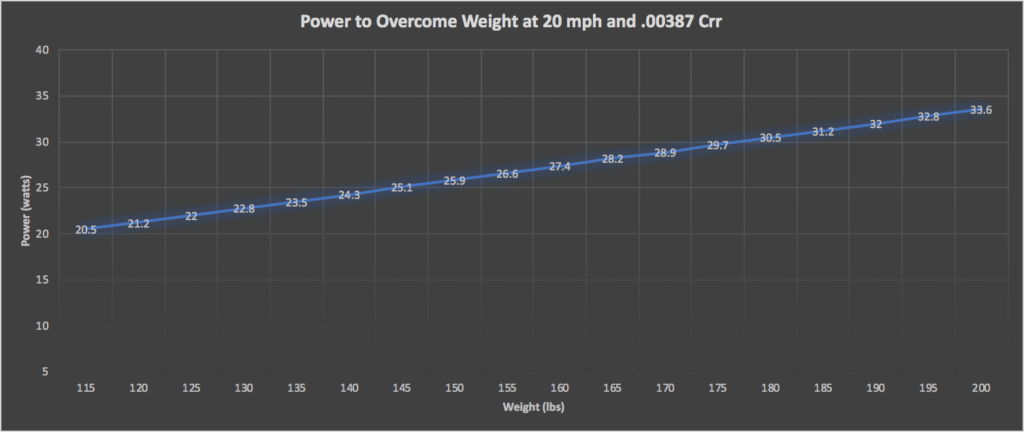
The chart below assumes a fixed Crr of .00387, fixed speed of 20 mph and a standard 18 lb bike setup. By varying weight we can see the direct impact it has on the power needed to overcome rolling resistance friction.
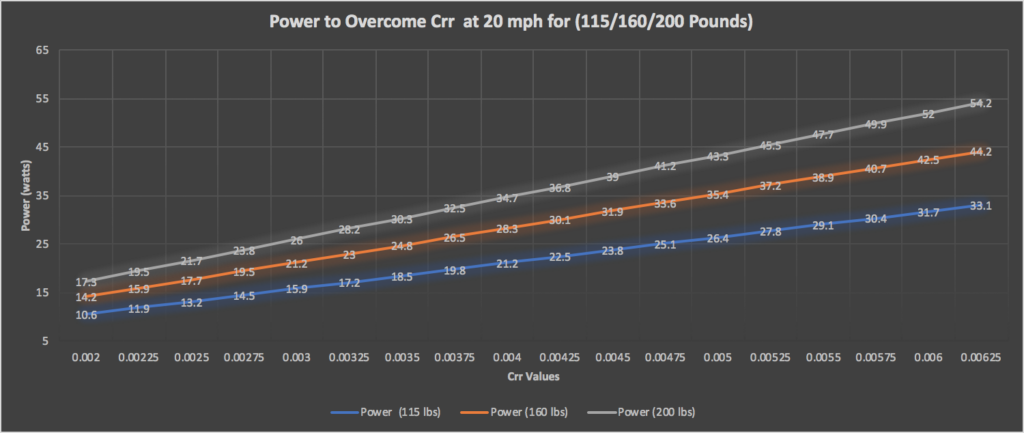
Now if we fix weight and speed and vary Crr from a very good tire value to a poor tire value we can see the impact from Crr changes. Below we have plotted the results for riders of three different sizes all with a standard 18 pound bike setup.
Weight obviously matters quite a bit; however, there is something to remember about equations that are linear. The final force impact will be the same based on percentage reduction in either Crr or weight. With current tire advancements it’s easy to find a 25 percent or even a 50 percent reduction in Crr, but a 25 percent reduction in weight is much harder!
So what this means is that if we are just isolating the variables to consider as they relate to rolling resistance, then Crr and speed are the major components. Luckily this information is finally becoming readily available and for a relatively low cost per watt savings, and anyone can take advantage on race day.
There are of course other reasons to not always go with the fastest tire. You may also consider puncture avoidance, longevity or specific training tires, but to really show the impact, we look at two examples: one from the World Tour and a famous one from IRONMAN.
In a Matter of Seconds
At the Pro Tour level, athletes ride extremely fast! This is especially true during Individual Time Trials. What is also important is how close times can be between the top contenders, not just for individual stages but for the entirety of a Grand Tour.
After thousands of kilometers and 89 hours of racing, the 2018 Giro de Italia was decided by just 46 seconds with Chris Froome winning over Tom Dumoulin. These results emphasize the importance of every second out on course.
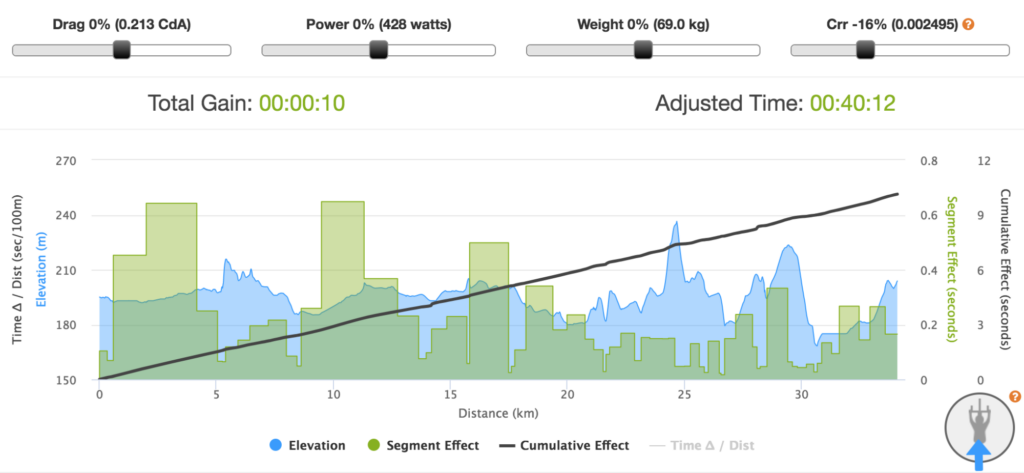
Before the final time trial stage of the Giro, we modeled Tom Dumoulin’s performance using estimates of his aero position and power. Looking at his equipment we already knew he was riding an extremely fast rolling resistance tire, but now we could play what if scenarios against the best tested tire.
In this case we look at the Vittoria Corsa Speed Tubular tested at .00297 Crr vs. their Tubeless version measured at .00249. The analysis shows a 10 second benefit which at those speeds is equivalent to 4 watts of savings! That might not sound like a lot but when grand tours are won or lost by less than a minute, those seconds can make a big difference.
While this may not be an entirely fair comparison due to tires having to match the sponsored rim types etc, it does clearly show the significant impact rolling resistance can have even on the highest end tires.
Bit by the Gator
There are some famous stories about the great American ITU and IRONMAN triathlete Andy Potts racing the world championship course on Continental Gatorskin tires. By all accounts and reviews these tires are excellent in many ways and as the name implies they rarely, if ever, flat; however, they are not known for having great rolling rolling resistance.
In fact in testing they tend to test on the very low end compared to Continental’s own GP 4000s and newer TT series tire offerings. So how did this choice effect Potts’ time and more importantly how would it impact an age grouper?
Because the vast majority of age groupers ride slower than pros, and we know the power required to overcome rolling resistance increases with speed we will focus the analysis on a Kona age group performance.
If we assume an age group athlete averaging 200 watts with a moderately aggressive aero positioning and CdA (drag coefficient) using 2017’s ideal weather conditions and vary the tire rolling resistance, we can find the time gains that are possible based on tire selection.
| Tire | Crr | Time | Time Gain |
|---|---|---|---|
| Gatorskin | .00606 | 5:16:45 | 0:00 |
| Gran Prix 4000s II | .00387 | 5:05:43 | 11:02 |
| Gran Prix TT | .00315 | 5:02:15 | 14:30 |
So while the difference from the very good all around Conti 4000s to the shorter race specific TT tire might not be worth the potential for flatting, it is clearly obvious that having a high rolling resistance training or all weather tire will cause a significant time disadvantage.
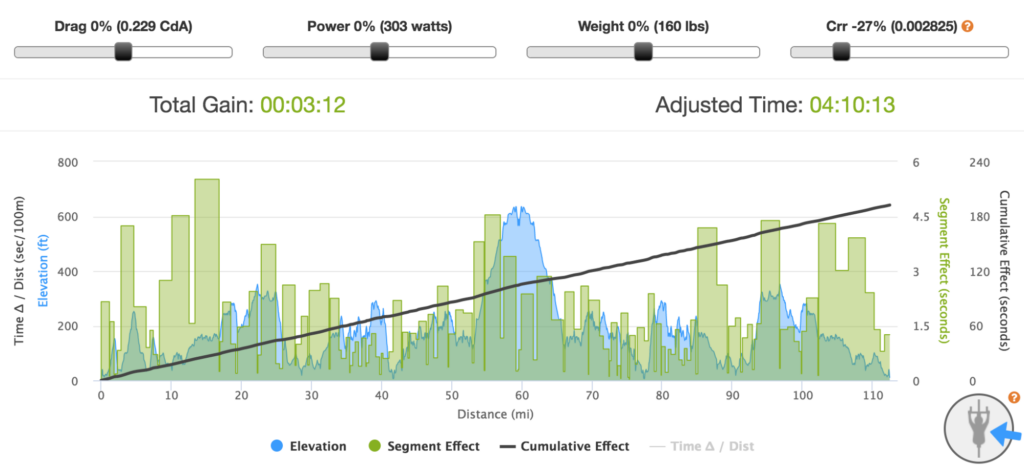
For fun we looked at the impact of what the best clincher / tube combination (Gran Prix TT with Latex Tubes) would have been for Lionel Sanders’ time last year. While we don’t think this combination would be worth the puncture risk when the margin of victory of Lange over Sanders at Kona was only two minutes and 42 seconds, some athletes might be willing to take the gamble!
In short, your tire selection can make a big difference. By testing out different scenarios of both rolling resistance, weather, average power and more, you can be better prepared to have your best race.
Don’t let an easy fix like tire selection cost you on race day. Sign up for Best Bike Split today for free and get your race day plan dialed in.
