Direct measurement of oxygen volume during maximal exercise, or VO2max, is regarded as the most precise method for determining cardiorespiratory fitness, which is the ability of the circulatory and respiratory systems to supply oxygen during sustained physical activity.
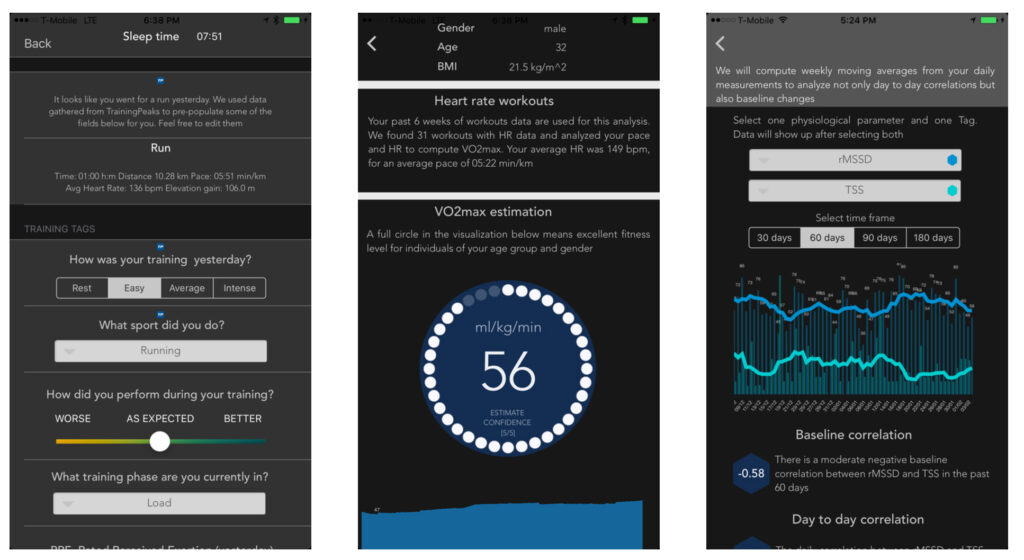
As more products on the market start to provide VO2max estimates, it’s important to try to understand how these models work, what are the advantages of models using certain predictors (resting heart rate, HRV, workouts data, etc.), what are the general limitations and what we can use these estimates for. In this post, I’ll go over the main differences in models using no physiological data, resting physiological data and workout data to estimate VO2max. We will show how VO2max estimates from workout data provide several advantages. In a recent publication using HRV4Training data, we showed a moderate-to-high correlation between our VO2max estimate and real-life running performance over distances between the 10K and full marathon, highlighting how these VO2max estimates could be used as a proxy to performance. Using the latest TrainingPeaks APIs, you can link HRV4Training to TrainingPeaks and get VO2max estimates directly from workout data, as explained here.
In this post, we will analyze three sets of parameters:
- Anthropometrics data only (or non-exercise models), including Body Mass Index (BMI), age & gender (some websites or “online calculators” use this approach).
- Resting physiological data, including anthropometrics and resting Heart Rate (HR) and Heart Rate Variability (HRV).
- Sub-Maximal HR data (workout data), such as HR while running at a certain pace, as used in HRV4Training, Firstbeat and Garmin.
Anthropometrics Data Only (Non-Exercise Models)
Models estimating VO2max using anthropometrics data only have been proposed for many years in research (see Jackson et al., published in 1990, or Baynard et al., just published). The goal is to get to a decent estimate without having to perform any measurement or test. Some of the most recent models actually do include resting heart rate measurements, as anyone can easily collect their resting heart rate, and some other models also include a person’s activity level, quantified in different ways (e.g. a number indicating how active you are).
Our dataset is about 50 individuals that I collected during my Ph.D. studies. Regardless of differences in the populations investigated, results are very similar to published literature. For example, Baynard reports R2 = 0.22 when including only BMI as the predictor and R2 = 0.57 when adding BMI, age and gender. On our dataset, when replicating the author’s work, we get R2 = 0.18 for BMI only and R2 = 0.54 when including BMI, age and gender. Considering that R2 (and any other metric) is highly dependent on the dataset (for example, on how much variability we have in the data, for both predictors and predicted variables), these numbers are extremely close. A good starting point for our modeling.
Why These Variables?
VO2max is known to decrease with age, is lower in women, and is also lower in individuals with higher body fat. As the aim of these models is to be as simple as possible, BMI is typically used as a way to capture body type, even though there are obvious limitations, as BMI does not capture anything related to actual muscle mass compared to body fat.
Resting Physiological Data (HR and HRV)
Things get more interesting when we start including physiological data. What is the rationale behind including resting heart rate? Physiologically speaking, with a more active lifestyle or, more specifically, with aerobic training, we have changes in the heart (muscle), resulting in increased stroke volume and reduced heart rate. As heart rate reduces with increased aerobic training, and VO2max / fitness also increases, it makes a lot of sense to use resting heart rate to predict VO2max.
Now the more interesting question is, how much better can we estimate VO2max when including heart rate? If we go back to our previous dataset and include resting heart rate together with BMI, age and gender, we obtain R2 = 0.59, a small but significant improvement compared to the previous R2 = 0.54. Models including non-exercise parameters combined with physiological data have also been validated in the past and sometimes showed poor results, see Esco et al.. However, they do perform better than the previous models, including only anthropometric data.
What about HRV? Adding HRV seems to bring no improvement (same R2 and standard error that we had before, including resting HR). As a matter of fact, adding HRV and removing resting heart rate also brings no improvements with respect to the original model using only anthropometric data. This is something I’ve been arguing for some time, as HRV reflects very well training load and the impact of different stressors, but not necessarily fitness or aerobic capacity. It is true that some studies showed improvements in baseline HRV for individuals starting an aerobic training plan. However, these findings often failed to be replicated (also, typically, everything changes when taking inactive people and getting them active, however, if we take a group of already active people, things get more challenging). Additionally, there is so much variability in day-to-day HRV scores (easily 50 percent of your baseline or more) that, in general, I am personally a bit skeptical of any HRV data reported as a single snapshot before or after a study. In my opinion, a baseline of at least a week should be collected pre- and post-study in order to get more confident on an individual’s HRV level without being too sensitive to acute variations; otherwise, we might just be trying to interpret noise.
Sub-Maximal Heart Rate Data (e.g. HR while running)
The rationale behind including sub-maximal HR data is the same as for resting HR data. As we train aerobically and get more fit, sub-maximal HR reduces, meaning that we can, for example, run at the same speed but with a lower heart rate. The reason why we prefer to use sub-maximal HR with respect to resting HR is that these individual differences due to fitness get exacerbated during exercise. Two individuals of quite different fitness levels might have a very similar resting HR, say 50 and 55 bpm. However, during the same intense exercise, say running at 12 km/h, the HR of the unfit individual will be much higher (all other things being equal, so similar body size and age, etc.). This is the principle we exploit with our VO2max estimation in HRV4Training, as we capture workout data from TrainingPeaks, and can analyze HR at different speeds for a broad set of individuals. Intuitively, the ones that can run faster and keep their HR lower, are most likely the fittest.
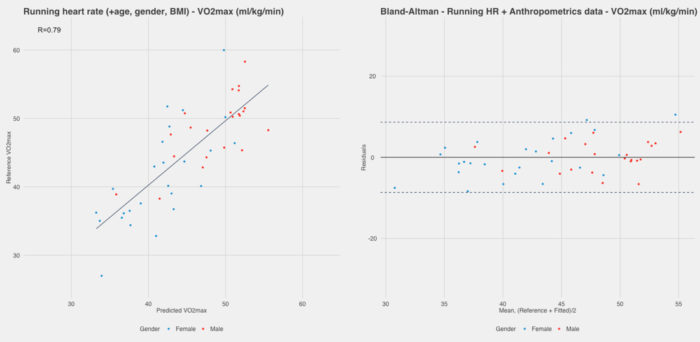
Let’s include sub-maximal HR in our models. What we get for running HR, even at a speed as low as 8 km/h is R2 = 0.67 and a standard error of 4.1 ml/kg/min. Much better than before.
Here are the results of the subject-independent analysis:
Highlighting the Importance of Sub-Maximal HR Data
After reading above, and looking at the plots, you might be asking yourself if it is really worth it to include all the additional physiological data and context for relatively small improvements. Correlation in estimated VO2max for subject-independent models goes from 0.72 to 0.79. This is a change good enough to publish a paper, but is it really useful to your individual case? Still, much of the variance is not explained by these models (more on this later in the limitations section).
Here I’d like to highlight how including sub-maximal HR is extremely important and is actually the only way to discriminate between individuals that are similar, which is probably your case if you are into training — hence in the more homogeneous and fit part of the population.
It’s always easy to show a high correlation or R2 on a dataset with much variability. Say we take thousands of individuals covering a very broad range of BMI and VO2max, from sedentary, obese, unfit individuals to IRONMAN participants. Obviously, BMI will be a great predictor of the differences in fitness between these individuals.
But what if we look at similar individuals? People can have similar body sizes (and ages) and yet be extremely different from a cardiorespiratory fitness point of view. Without physiological data, we cannot tell the difference. To highlight this point, I’ll isolate a subset of participants with similar characteristics, for example, I took individuals aged 21-25 years old and with BMI between 22 and 24 kg/m2, male-only. This is a rather homogenous sample in terms of our predictors. What happens when we try to predict their VO2max using anthropometrics data only?
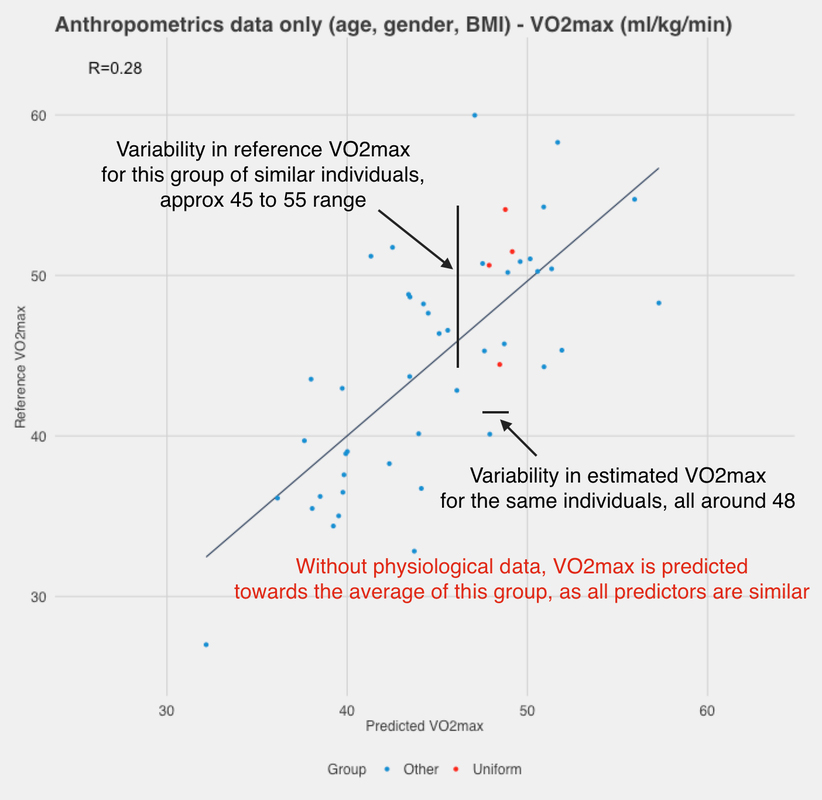
As highlighted in the figure above, without physiological data, we cannot discriminate individuals with different fitness levels but similar anthropometric data. All individuals are predicted at more or less the same VO2max as they are similar according to the model. We need physiological data to be able to discriminate them, as sub-maximal HR will reflect much better their cardiorespiratory fitness level, due to the known relationships explained above. The correlation between estimated and predicted VO2max for this subset of similar individuals is only 0.28, much lower than when we looked at the entire sample. Let’s now look at the same subset of individuals but for our latest model, the one used in HRV4Training, which combines anthropometrics data and HR while running:
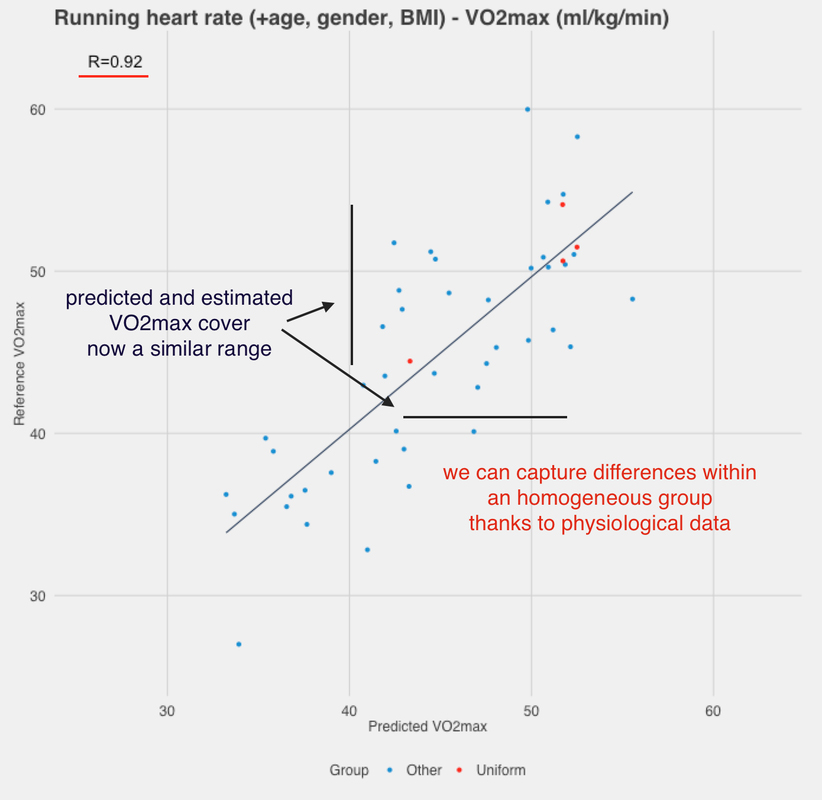
We can see now how the same group is predicted much more accurately, and we can clearly discriminate between the different fitness levels, with one individual clearly being less fit regardless of the low age and BMI.
This is the most accurate model we can develop using anthropometric data and physiological data during exercise, and a very similar model is currently implemented in HRV4Training.
Relation between estimated VO2max and running performance (10K, half and full marathon)
We talked a lot about modeling and the advantages of using physiological data, especially workout data, to estimate VO2max. However, the most important point here is the practical implication of these models. They work better for our lab predictions, but are they really useful? What can they tell us?
As our dataset grows and more people are linking HRV4Training to their actual training data, we started answering these questions by analyzing the relation between real-life running performance and our estimated VO2max. A strong relation would mean that our estimate is indicative of running performance.
We first built laboratory-based VO2max estimation models, including reference VO2max data collected using indirect calorimetry and then deployed our models in the HRV4Training app. More than 500 users linked the app and used the VO2max estimation models while running distances between the 10K and the full marathon over a period of one to eight months, creating a unique dataset on which to investigate the relationship between estimated VO2max and running performance. The analysis showed how estimated VO2max in the app is highly correlated with real-life running performance for running distances between the 10K and full marathon and therefore can be used as an effective proxy to running performance without the need for laboratory tests at the population level (full paper: “Relation Between Estimated Cardiorespiratory Fitness and Running Performance in Free-Living: an Analysis of HRV4Training Data” was accepted for publication at the International Conference on Biomedical and Health Informatics – BHI 2017). Here is the data presented:
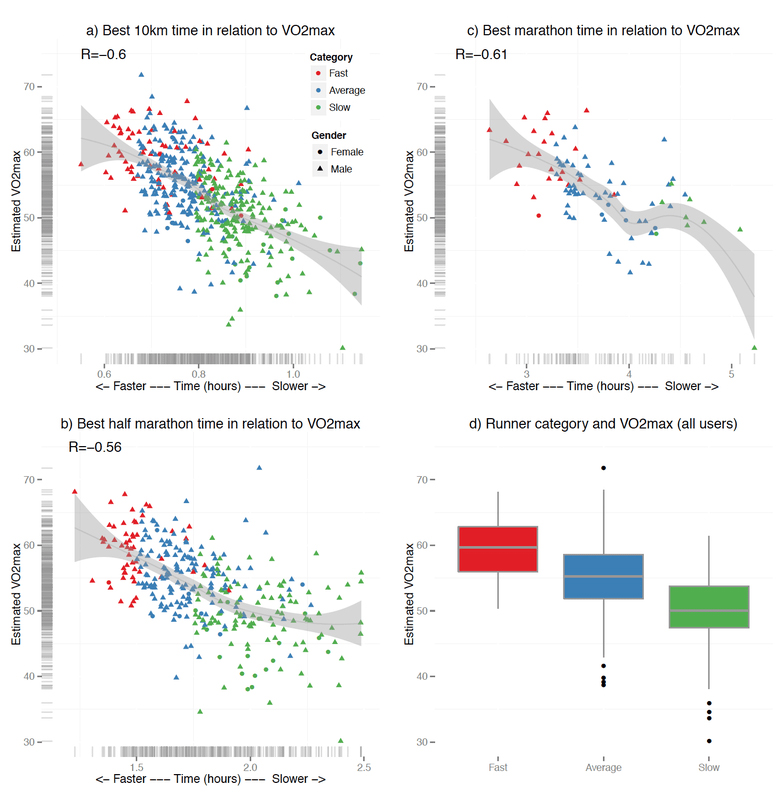
Estimated VO2max can potentially be used to track individual performance outside laboratory settings, driving motivation and helping athletes of all levels keep track of progress as well as adopt individualized training plans based on a person’s physiological response to training. While we looked at the relation between running performance and VO2max at the population level, it will be interesting as more data is gathered to investigate individual variance and if performance and VO2max estimates change accordingly over time within an individual.
