The holy grail of distance running has always been to use less energy and oxygen at specific speeds. The recent development of power meters raises the question whether we can use the new running metrics to learn how to run smarter, more economically, and, subsequently, faster.
In recent research with Radboud University of Nijmegen, the Netherlands, we found interesting correlations between Running Economy (RE) and Leg Spring Stiffness (LSS). This might be important because LSS is just one of the new metrics available to runners through running power meters.
Previously, research on the Energy Cost of Running (ECOR) showed how valuable this parameter might be for the day-to-day determination of running economy and running style improvement. Thanks to running power meters, we now have easy access to new metrics like these that might help in reaching the ultimate goal of running faster at a certain effort.
What is Leg Spring Stiffness?
In its simplest definition, LSS measures the stiffness of the muscles and tendons in your leg. As a result, LSS is a measure of how well a runner recycles the energy applied to the ground in each stride.
Increases in LSS indicate economy improvement over time. It important to keep in mind that LSS is individual and cannot easily be compared across different runners. As a result, LSS should be standardized for body weight in comparisons over time. Trends in LSS/kg for specific speeds should be the focus of any analysis.
What is Running Economy (RE)?
Next to VO2 max, Running Economy (RE) is widely considered the best predictor of endurance running performance. Economical runners use less oxygen compared to other runners at the same speed.
However, most runners are not in the position to determine their RE often. RE is usually determined in a physiological laboratory using data from oxygen consumption VO2 at a constant submaximal speed.
RE is a complex, multifactorial concept that reflects many metabolic, cardiorespiratory, anthropometric, biomechanical, and neuromuscular aspects. With so many factors, it is not possible to come to firm conclusions which running style is the most economical. Nevertheless, it is possible to reduce the RE (and thus become more economical) with training.
What is Energy Cost of Running (ECOR)?
With the emergence of running power meters, it is now possible to easily measure an alternative for RE using the Energy Cost of Running (ECOR). ECOR can be calculated with the power and the speed from a run using a simple formula.
Based on the theoretical relationship between RE and ECOR, we can presume that runners who reduce their ECOR will also reduce their RE resulting in more economical and faster performance.
Running watches now provide the opportunity to determine many running metrics such as cadence, ground contact time (GCT), vertical oscillation (VO), and stride length. Using all of these metrics, runners can optimize their running style in order to reduce their ECOR (and ultimately their RE).
Higher LSS Is Correlated With Lower RE
In 2018, we performed a research project at the physiological laboratory of Professor Maria Hopman at the Radboud University of Nijmegen (RUN), the Netherlands. The project included 13 young runners (12 to 17 years). All runners performed a maximal incremental exercise test on the treadmill (velocities between 11-21 km/h), both at the beginning of the project (baseline) and after 16 weeks of training. Oxygen consumption was monitored and various running metrics were recorded using a Stryd power meter.
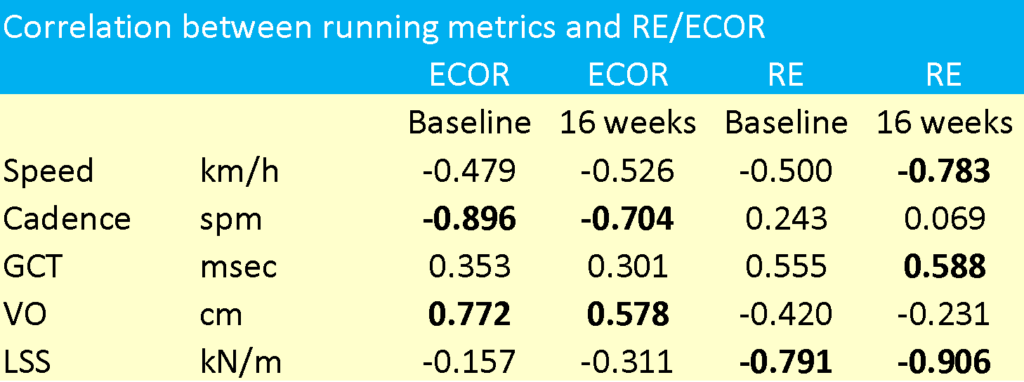
A Pearson correlation analysis was conducted on all the results to assess the relation between ECOR, RE, and various running metrics. The primary findings are summarized in the table below:

Regarding ECOR, the correlations confirm that ECOR is lower at higher speed, at higher cadence, at lower ground contact time, and at lower vertical oscillation. This is in line with theory that vertical movement and ground contact should be limited to improve performance. It is noted that the relationship between ECOR and cadence and the relationship between ECOR and vertical oscillation were statistically significant at the 0.05 level.
Regarding RE, the results confirm that RE is lower at higher speed and at lower ground contact time. Both correlations were statistically significant after 16 weeks and are in line with literature findings. The correlation between RE and cadence and the correlation between RE and vertical oscillation are counterintuitive, but these are weak and may reflect the fact that RE is the composite of many parameters. The most striking result is the strong and statistically significant correlation (even at the 0.001 level) between RE and LSS.
Physiological explanation for the relation between LSS and RE
As explained before, the LSS represents the stiffness of the leg muscles and tendons. Based on the the assumption that stiff muscles and tendons are able to recoil more elastic energy upon landing, runners with a higher LSS would use less energy and oxygen lowering their RE.
We believe that the strong correlation between RE and LSS is very important. It may even explain the counterintuitive relationship between RE and VO. From the results of individual runners, we noted that runners with a high VO also had a high LSS. This means that most of their higher vertical energy use may have been returned as elastic energy.
The results are also very promising for applications in the running community as runners may be able to use LSS as an indicator of their RE on a daily basis.
Conclusions
The results confirm our earlier findings that the running power data can be used to optimize training and running technique on a daily basis. Improvements in training should lead to both lower energy cost (ECOR) and oxygen cost (RE) of running at certain speeds.
In addition, RE was found to be strongly correlated to LSS. That means that runners with a higher LSS have a superior RE, which may indicate that LSS is a useful way for coaches to measure (through proxy) RE.


