One of the new features found in WKO4 is an extensively-tested and rigorously-validated mathematical model of the maximal exercise intensity (power, in the case of cycling) versus duration relationship. This model serves as the foundation for a number of other new applications, as the “Parthenon” figure shown in Figure 1 below attempts to illustrate:
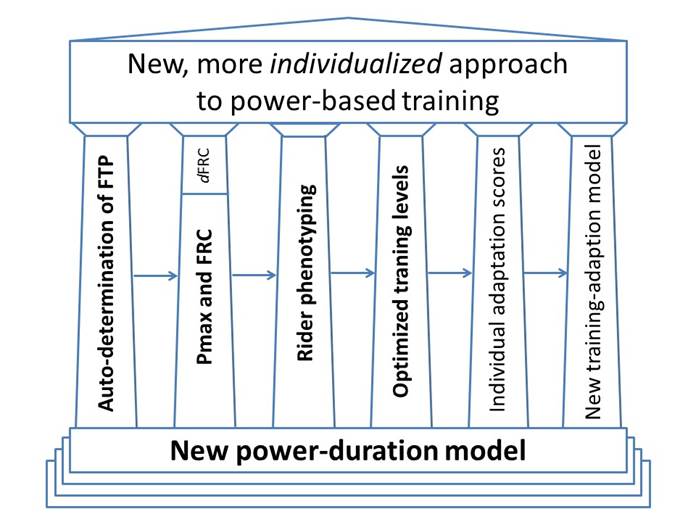
Figure 1. “Parthenon” of individualized training built upon the foundation provided by the new power-duration model in WKO4.
Those shown in bold font have already been implemented in WKO4, whereas those shown in plain font (as well as possibly others) are slated for implementation in future updates to the program. Rather than discuss the applications of the model however, the purpose of this article is to present the motivation and rationale behind its development, as well as to present evidence supporting its accuracy and precision, and hence its validity. For a more detailed discussion of such matters, readers are encouraged to view the introductory webinars found here, here, and here.
Why attempt to mathematically model the power-duration relationship?
Many people mistakenly assume that the primary purpose of creating a mathematical model of the power-duration relationship is to be able to use it to predict maximal performances at various durations. Indeed, any good model, if based on valid data, is quite capable of accomplishing this task. In point-of-fact, however, for cyclists using power meters this specific application generally provides only limited benefit. This is because if the available data are sufficient to be adequately/accurately modeled, they are also generally sufficient to be used to provide pacing guidelines.
Furthermore, since “the best predictor of performance is performance itself”, in cases where highly-accurate information regarding an individual’s maximal sustainable power for a particular duration is required (e.g., for an hour record attempt), then the best way to obtain such information is to simply perform a formal test. This is more accurate rather than relying on the predictions of a mathematical model, no matter how accurate it might happen to be. Thus, contrary to what seems to be commonly thought, in the present context mere prediction is generally not an important application of a power-duration model, or least not one really worthy of the effort required.
If predicting performance at various durations isn’t the primary reason to attempt to model the power-duration relationship, what is? The answer to that question is two-fold:
- To provide quantitative insight into an individual’s unique abilities and the physiological determinants thereof.
- To provide a robust mathematical description of the mean maximal power data, thus helping assure the accuracy and stability of the outputs of the applications shown in Figure 1 above.
The remainder of this article will primarily focus on the first point listed above. With respect to the second point, however, it should be clear that truly individualized training levels cannot be readily based upon “raw” mean maximal power data. Doing so would require an inordinate amount of formal testing to cover even a limited number of duration and could fluctuate wildly depending upon how recently performance over a particular duration was either formally or informally tested. Similarly, the calculation of an individualized adaptation score could be easily skewed if directly referenced to the raw mean maximal power data, which fluctuates significantly over time due to factors other than changes in fitness.
Development and validation of the WKO4 power-duration model
Once it was concluded that modeling the power-duration relationship was necessary to support robust, truly individualized training metrics, attention was turned towards precisely how to accomplish this goal. A number of models presented in the scientific literature were evaluated, but all proved to be overparameterized, conceptually-flawed, and/or to have too narrow of a domain of validity (in terms of exercise duration) to be utilized. A novel model was therefore developed in the summer of 2012, based on first-principles reasoning and leveraging the author’s experience modeling metabolism as studied using stable and radioactive isotopic tracers. This new model is conceptually consistent with the primary metabolic factors thought to limit exercise performance over varying durations, as shown in Figure 2 below.
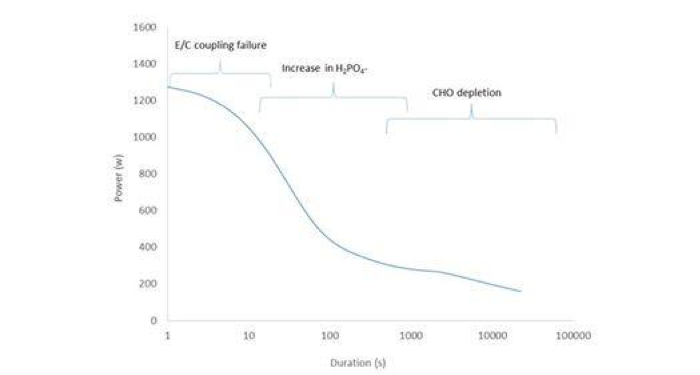
Figure 2. Principal metabolic factors thought to limit exercise performance as a function of duration. E/C = excitation/contraction; H2PO4- = diprotonated inorganic phosphate; CHO = carbohydrate.
Once this new model was developed, it was rigorously evaluated and tested using standard approaches, as listed in Figure 3 below. The test dataset consisted of mean maximal power data representing nearly 200 season-athletes, including both men and women ranging from “weekend warriors” to World Champions and Grand Tour winners. In particular, special emphasis was placed upon the accuracy, independence, and external validity of the parameter estimates, since the latter were of primary interest (vida infra). Although a complete description of all of the testing that was performed is beyond the scope of this article, evidence demonstrating the robust nature of the model is presented below.
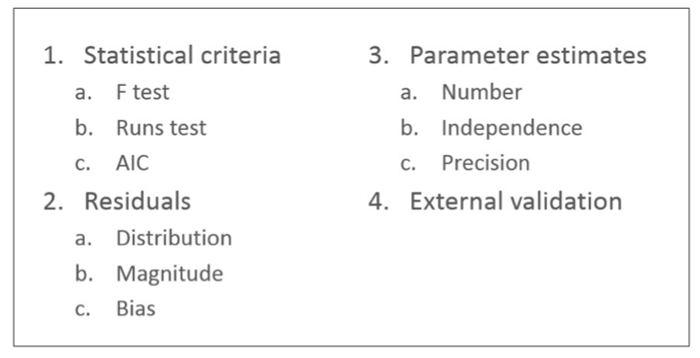
Figure 3. Standard methods used to evaluate mathematical models.
Unbiased Residuals
As shown in Figure 4 below, the normalized residuals (i.e., (predicted value – observed value)/observed value x 100%) are normally distributed and centered on zero, with a mean absolute error (i.e., either high or low, ignoring the sign) of only 3.2±2.8 percent. In other words, from a statistical perspective the model is unbiased, sometimes predicting a bit high and sometimes predicting a bit low, but on average being very close to the observed data.
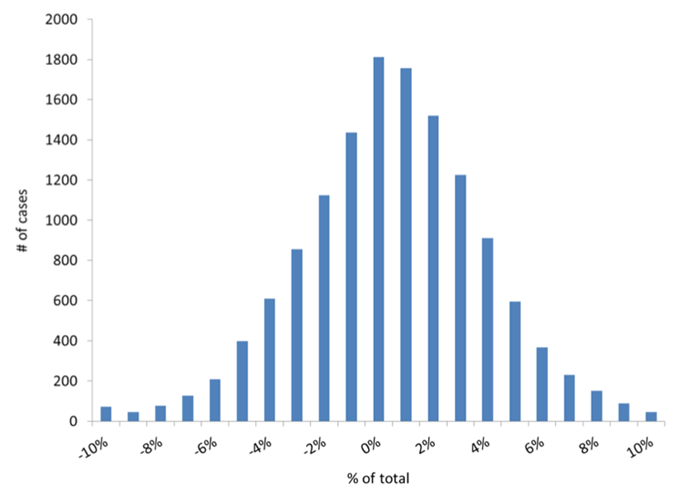
Figure 4. Distribution of normalized residuals.
As well as being normally distributed, as shown in Figure 5 below the normalized residuals are independent of duration, overlapping 0 percet from 1 s out to almost ~100,000 s (~28 h), or over six orders of magnitude (the increasing variability beyond ~20,000 s, or ~5.5 h, is due to the ever-decreasing number of cyclists who rode for a very long time). Again, this demonstrates the lack of any bias in the model.
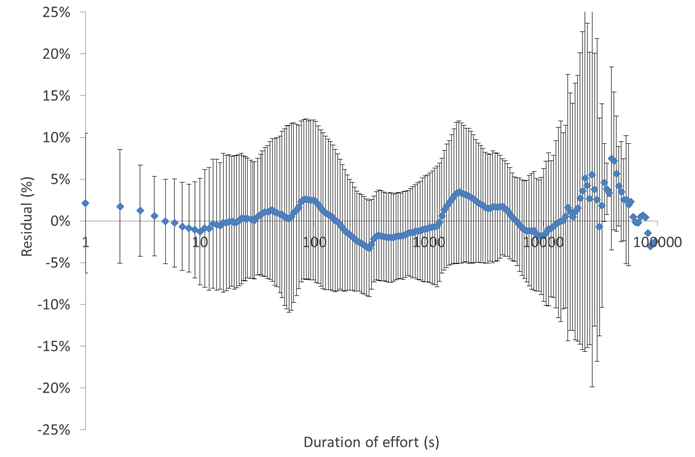
Figure 5. Normalized residuals as a function of exercise duration.

Independence of parameter estimates
Models that are overparameterized result in close coupling between the parameter estimates, making it difficult to “pry them apart” with accuracy. Stated another way, in an overparameterized model, more than one parameter is being used to represent a given entity, such the parameters end up being closely correlated. However, in the WKO4 model there is limited correlation between the most important parameters (Table 1 above). This is true even though from a physiological perspective some association between Pmax and FRC would be expected (since both are to some degree dependent upon muscle mass as well as muscle fiber type), and the raw mean maximal power data were not normalized to body mass (meaning that the fact that individuals with a higher Pmax also had, e.g., a higher FTP could simply be due to their being bigger).
Precision of parameter estimates
Together, the minimal and unbiased nature of the residuals and the independence of the parameter estimates means that they can generally be “nailed down” with good precision, especially FTP (Table 2). On the other hand, the estimated Pmax and FRC tend to be somewhat more variable, in part because relatively speaking fewer points significantly contribute to their calculation – that is, only power at shorter durations exert significant “leverage” on the values obtained. Nonetheless, the precision of both parameters is sufficient to, e.g., detect training-induced changes in their magnitude, or to identify artifacts in the data (e.g., when power measured during a handful of seconds significantly exceeds Pmax, it is almost always due to incorrect values stemming from the difficulty many power meters have with accurately measuring power over short durations).

External validity of parameter estimates
The ultimate test of any mathematical model is the external validity of the parameter estimates, i.e., how accurately they predict or reflect some “gold standard.” Ideally, this would entail comparing the model-derived parameter estimates to physiological measurements, e.g., comparing the model-derived FTP to power at maximal lactate steady state (MLSS). Unfortunately, no such physiological data were available to assess the performance of the model. Furthermore, there is no physiological measurement that is conceptually identical to FRC – the closest would be maximal accumulated O2 deficit (MAOD), but unlike MAOD the model-derived FRC includes an aerobic component. Thus, in lieu of such tests the model-derived parameter estimates were compared against mean maximal power values also thought to be reflective of the pertinent underlying physiology, i.e., 1 s for maximal neuromuscular power, the classic 30 s Wingate test for fatigue resistance during high-intensity, non-sustainable exercise, and 95% of 20 min power as an estimate of FTP. As shown in Figures 5-9 below, excellent agreement was found between the WKO4-model derived parameter estimates and these alternative surrogate markers.
Summary
The mathematical model of the power-duration relationship implemented in WKO4 is conceptually and statistically robust, and provides precise, unbiased estimates of key parameters reflective of important physiological determinants of performance. As such, it provides a sound “foundation” upon which other calculations can be based, resulting in a more individualized, and hence optimized, approach to power-based training.
- Note that the calculated values are dependent upon the assumption that the power is independently measured at each duration, which is clearly incorrect. Furthermore, even if this assumption held true the calculated values would only be asymptotically correct. Alternative approaches (e.g., “bootstrapping”) exist for estimating the precision of parameter estimates obtained using a non-linear, iterative model, but are computationally intense. It is therefore standard practice to calculate the coefficients of variation (CVs) the parameter estimates using conventional statistical assumptions, since at a minimum they provide a relative measure of the confidence that can be placed on the values obtained.
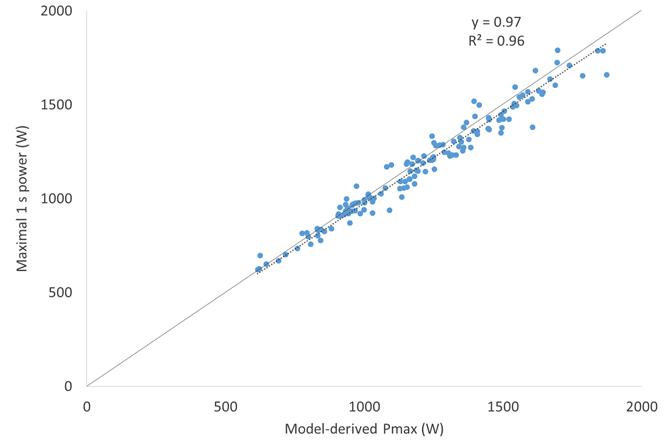
Figure 6. Correlation between maximal 1 s power and model-derived Pmax.
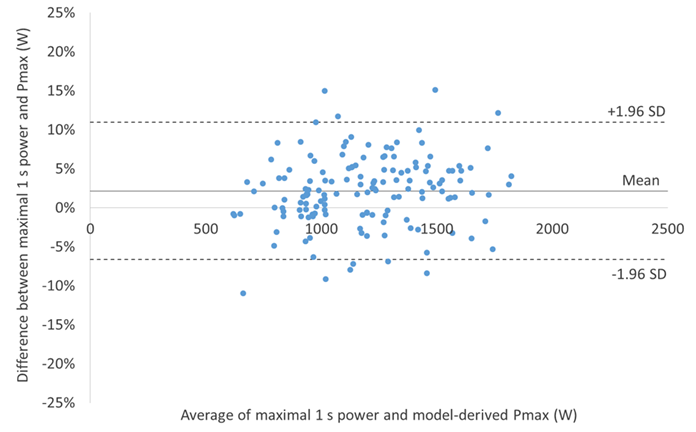
Figure 7. Bland-Altman plot illustrating limits of agreement between maximal 1 s power and Pmax.
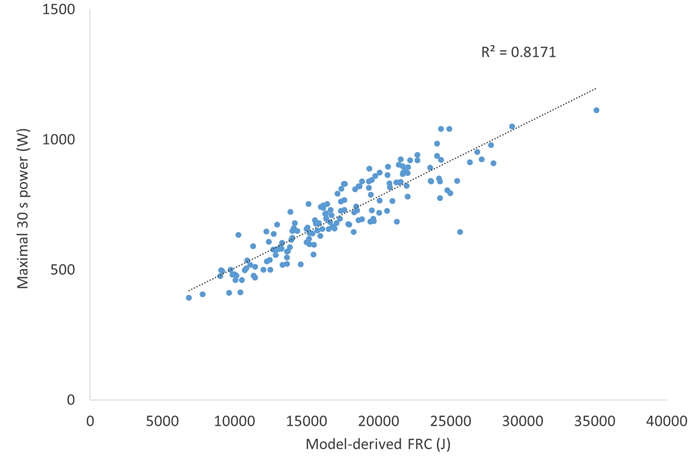
Figure 8. Correlation between maximal 30 s power and model-derived FRC.
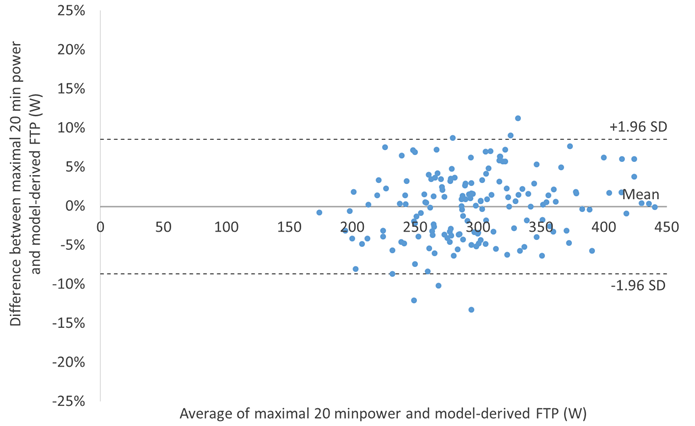
Figure 9. Bland-Altman plot illustrating limits of agreement between 95% of maximal 20 min power and model-derived FTP.
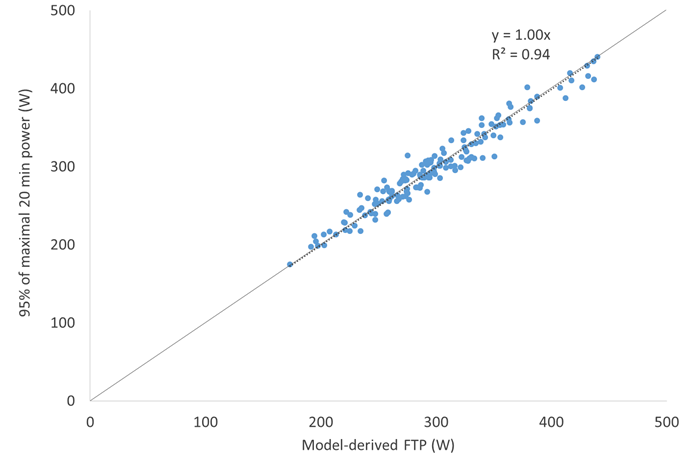
Figure 10. Correlation between 95% of maximal 20 min power and model-derived FTP.


